Quick Portfolio Update and a debrief on BRK-B
A quick note on my portfolio, since I haven't written much for the past 3 months. Things are largely looking okay, specially given that markets have continued to be soft in the intervening 3 months or so.
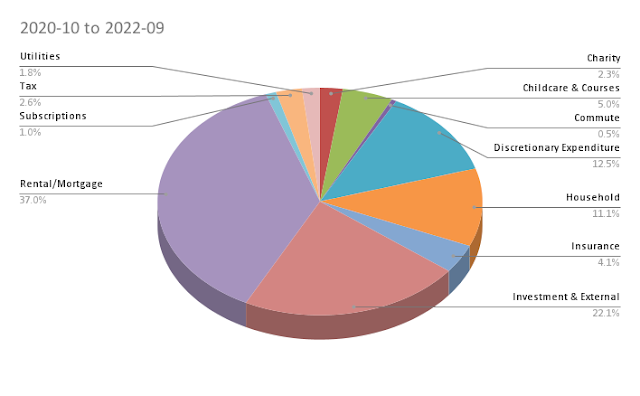
Headline Performance Numbers*
As you can see, there has been some improvement in the Alpha numbers. That's largely because I got a one-time tailwind through some 390/340 October PUT spreads that I picked up when SPY was trading at 406 and that handsomely paid off buoying the portfolio in what has otherwise been a time of moderate returns. It was good to have a win, but it is one-time and I don't dwell much on timing the markets as such.
There have been some losses on a few tickers - mostly Chinese tickers and big tech - nothing out of the ordinary and very much along the lines to where the market has moved. I reckon the losses and the options win cancel each other out, which was kind of the intended outcome of buying the PUT spreads in the first place. Since I last wrote about my portfolio, there have been no material changes to geographic, thesis or term, though I have been putting away more money into long term holdings, increasing the slice of that pie. So, that's that.
A debrief on Berkshire

Now, on to more interesting thoughts in my head. My largest holding is BRK-B and I added significantly to that position in the past 3 months (increasing my holdings by about 25% during the period). Over the weekend, Berkshire dropped their quarterly results and I want to put some thoughts about it here. People smarter than me have analysed the results, so please head over here to read, what I believe is the best analysis.
Berkshire Hathaway released its 3Q 10-Q and earnings release this morning. In what was a very quiet quarter on the capital allocation front, there are a number of interesting developments in the filing and particularly the MD&A. A few comments on the quarter and developments. 1/
— Christopher Bloomstran (@ChrisBloomstran) November 6, 2022
Onto my thoughts - BRKB trades at a Market Cap of $630B. It holds $105B of cash. It also holds marketable securities worth $300B. That makes the core Berkshire businesses worth something like $225B. The core businesses generated $6.9B in the last quarter and $21.7B in the three quarter this financial year.
Assuming that the core businesses generate another $6.9B in the coming quarter, that's roughly a $28.9B print for the full year. So, the core businesses are transacting at 7.8x P/E. But add back the $4.6B it collects on its cash holdings each year, and suddenly, the print per year gets close to $33.5B (even after excluding all currency fluctuations), putting the P/E closer to 6.7x.
(Please note I am not adding dividends in the net print, as the valuation of that cash flow is already fully baked into the $300B of the marketable securities, that is already valued by the market inclusive of the dividend generation of those companies. So, this $33.5B print is everything core to the business plus coupons from the treasuries.)
There is obviously some threat to the business from the Alternate Minimum Tax provision in the Inflation Reduction Act, as unrealised gains might be taxed taking material cash out of the business. Berkshire's quarterly statements have this wording:
On August 16, 2022, the Inflation Reduction Act of 2022 (“the 2022 act”) was signed into law. The 2022 act contains numerous provisions, including a 15% corporate alternative minimum income tax on “adjusted financial statement income”, expanded tax credits for clean energy incentives and a 1% excise tax on corporate stock repurchases. The provisions of the 2022 act become effective for tax years beginning after December 31, 2022. We currently do not expect a material impact on our consolidated financial statements. However, we expect future guidance from the Treasury Department and will continue to evaluate the impact of the Act as more guidance becomes available.
While I don't have enough understanding of either the changes in the tax provisions, or Berkshire's accounts, to be able to present a guidance on this, early indications from external commentators place the hit at about $3B a year.
Basing it on that estimate, the annual print after taking that out comes out to be $30.5B, or about $30B after rounding it down, putting the core businesses at 7.5x P/E. That's an incredibly cheap price point for a collection of business that has performed very well, sound management, sound balance sheet and with no obvious existential threat. Some businesses will face some head winds from time to time, but none of it explains the super cheap valuation.
If the core businesses were to roughly be even 80% of what S&P 500 is trading at (19.6), that would mean a P/E multiple of 16, or valuing the core businesses at $480B, and add back the cash and marketable securities, we would get $885b market cap, some 40% higher than today.
Even if the market never re-rates the privately held businesses to a more public-facing valuation, 7.5x is an incredible good P/E to pay for a business with an excellent record of capital allocation. As an ongoing shareholder, this means Berkshire's cashflow can be put to good use by reducing the share count as and when deemed necessary by the management, or by putting it to good use through acquisitions.
I might be missing something in my calculations here, but unless I am massively off the mark, I don't see how this is not one of the best businesses to hold in the long run. I definitely plan to do so.
* Beta for this calculation is monthly.
+ I use Vanguard FTSE All World All Cap (Acc) as my benchmark. Ideally I should be using the underlying index and not the fund itself, but doing so is a lot harder. Getting good clean data on the index, and needing to track its tax and dividend implications gets too cumbersome. Using the fund is the closest proxy, however, I am aware that it is not a perfect benchmark, as fees get added, and tracking errors start showing up. I believe they are minor in larger scheme of things.
^ Risk free return for Alpha calculations taken from http://www.worldgovernmentbonds.com/bond-historical-data/united-kingdom/10-years/

Comments