Portfolio Update - Jul 2022
Time for next portfolio update (last one here). In the last few weeks, my portfolio has managed to stabilize and perhaps even gain a little bit. This shouldn't come as a surprise to anyone, given that the FTSE All World All Cap Index (and a bunch of other market indices) have all had a good time in the same time period.
Let's get started with the charts and then get on to some commentary in the latter half of this posts.
Commentary
Markets are likely factoring in possible sightings of the end of the interest rate hikes. I am personally not convinced that the interest rate hikes are anywhere close to where they will be in the worst case, but I anyway don't worry about the short term macro changes in setting up my portfolio.
Like I wrote last month, I have been carefully observing if my portfolio can withstand the kind of drawdown / volatility and continue to generate beta, if not alpha, that we have seen over the past few months and continue to be quietly confident that it will do the trick.
In terms of Geography, there is a significant drop in the Australia allocation (from 16.1% down to 10%). This is partially because of the ResApp (ASX:RAP) special situation which played out well with a new offer at 20.6. I had held it in the hope of a renewed offer and have gotten out of the position after the offer came through. This has reduced my Australia allocation by a bit.
The other reason for the drop is that I have completely eliminated my Vanguard Australian Shares High Yield ETF (ASX:VHY) holdings and reallocated it to my Buy & Hold portfolio of about 50 stocks. VHY was meant to be a ETF to provide me some dividend earning potential and some slow and conservative growth while I focused on more interesting trades. Sadly, VHY has been a bit of a dividend trap, dropping when aggressive markets (say S&P 500) drop, but not growing fast enough when other markets did. I felt like I could easily substitute the desired behaviours from my own stock picking, which is what I have backed myself to do.
In very similar spirit, I have also cut out my Nikko AM Singapore STI ETF (G3B.SI) holdings, and reallocated that too into my Buy and Hold Portfolio. That has reduced my Singapore holdings down from 8.3% to 6.7%.
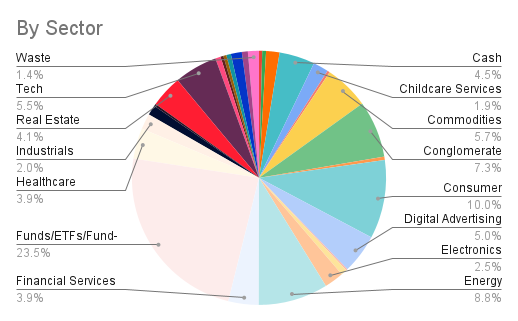
In terms of Sectors, there is a significant drop in Funds/ETFs which is precisely because of what I have written above and that has been replaced by a smattering of new sectors that have come in due to the reallocation. Conglomerate (primarily Berkshire-B) and Consumer are two sectors I have consciously rotated money into. I believe both are better allocations of capital for the next few years.
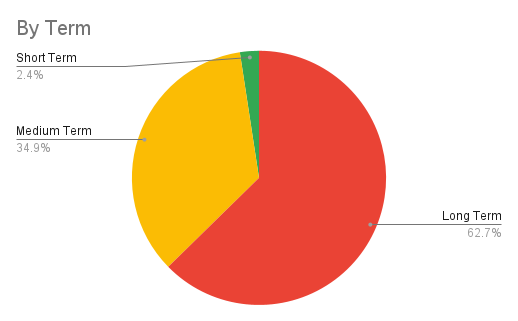
In terms of holding periods, my short term and medium term positions have reduced, primarily as some of my trades paid off (ASX:RAP for instance) while others didn't and I decided to close them out in order to clean up book.
No changes to Top-3 positions since the last update.
Headline Performance Numbers*
* Beta for this calculation is monthly.
+ I use Vanguard FTSE All World All Cap (Acc) as my benchmark. Ideally I should be using the underlying index and not the fund itself, but doing so is a lot harder. Getting good clean data on the index, and needing to track its tax and dividend implications gets too cumbersome. Using the fund is the closest proxy, however, I am aware that it is not a perfect benchmark, as fees get added, and tracking errors start showing up. I believe they are minor in larger scheme of things.
^ Risk free return for Alpha calculations taken from http://www.worldgovernmentbonds.com/bond-historical-data/united-kingdom/10-years/

Comments