(This post is perhaps a year late in coming. If this had been written before the market corrections had happened, and an attentive reader would have changed their investment strategy by reading it, could have perhaps saved the said investor a few quid and likely would have bought be a beer or a cup of chai. Sadly I write this post after the blog and have probably foregone a well earn round of beverage. Nevertheless I hope to provide a framework that can be used by readers in navigating changing economic situation in the future.)
There is so much talk about interest rates affecting stock market valuations and as the market corrected consequent to interest rates going up, a colleague of mine asked me how does a change in interest rate affect stock market valuations. As part of that conversation I tried my best to explain the fundamental effects of interest rates on Discounted Cash Flow (DCF) valuations. However, I made a mental note to follow up with a blog post where I can explain this with some illustrations. This post is that follow up and intends to be read by anyone curious about the mathematic machinations that connect interest rates and stock market valuations. This post will need basic understanding of maths (such as compounding and discounting), but nothing more than what you might have learned at high school (or perhaps sooner).
If you are an experienced investor, it is time for you to give this post a pass. But if you are investor who have never wandered into the realm of the mathematics of company valuations, the next few minutes might prove a reasonable use of your time.
As we know that a dollar or pound today is more valuable than the same dollar or pound in the future. Hence cashflow that a company is expected to be generated in the future needs to be discounted to today. You do it by discounting it at Risk Free Rate (RFR) - return that you could generate if you took no risk at all. At its core, DCF uses the expected future cash flows of a company and discounts them to today and you get valuation of a company. So when the interest rates change, then RFR changes and this impacts DCF calculations of every company out there.
Note 1: Please note that DCF has many inputs, all of which are subjective and hence 2 analysts may value the same company differently. However, if interest rates change, both analysts will have to change that particular input to their analysis. This post specifically looks at how that one input. i.e. interest rates affect valuations. This post is not a tutorial in DCF - there are ample tutorials online that do a great job of teaching DCF to beginners.
Note 2: Markets seldom trade a stock at what might be your estimation of the DCF. Market trades at the collective expectations, and behaviours of all investors and traders out there, and hence a stock might trade wildly different than what you think the company is valued at. However, the trends in price at which a stock will generally match the trend in your calculation of DCF, i.e. if your own DCF calculation of a company goes down after an interest rate change, it is very likely the stock is also down and vice versa.
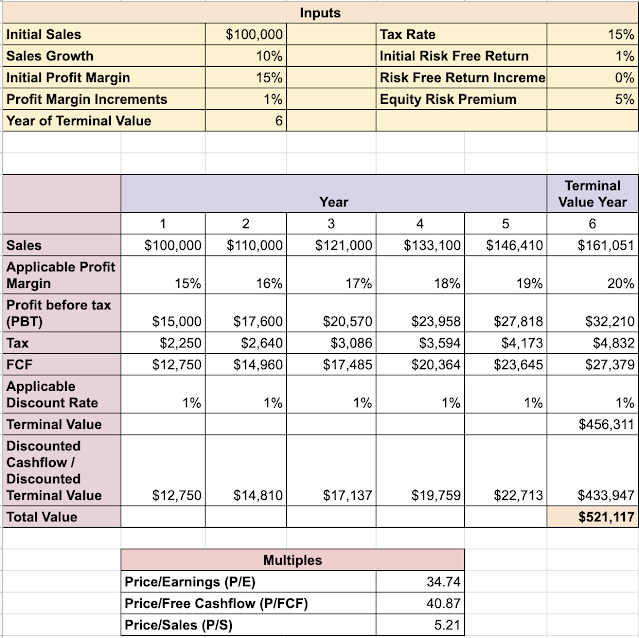
In this post I present an example company, primarily for purposes of illustration of DCF maths. In this company's case, the company has revenues that grow with time, and it has margins that improve with time. The company produces a profit every year and we are interested in calculating how much should the company be valued today. Terminal Value is the value of the company when it stops growing - all companies tend to either grow or shrink or stay in size with respect to market in different phases of their life. Obviously investors need to take into account what phase the company is in and apply the right kind of calculations to value the company. In this illustration, the company I have conceived has an extremely rosy projection of growing for 5 years and then fall in line with broad economy growth.
In this classic DCF valuation scenario, I have taken 5 years of growth and then the 6th year is used for Terminal Value (TV) calculation. There are multiple ways of calculating TV - I use the method of calculating TV as Profits (of the TV year) / (Equity Risk Premium + Risk Free Return). This is equivalent to multiplying the profits with market's average P/E. As I said there are multiple ways to calculate TV and we can split hairs over whether this is the right approach or not, but this approach is not unreasonable and I use it consistently in this blog post. So, the effects of changes in the valuations that I hope to illustrate won't be affected by the formula, but only what goes into it.
So, back to our sample company illustration:
As you can see, this company is being currently valued at $521,117, a P/E of 34.74 and P/S of 5.21. So far so good. The actual numbers itself aren't very important. This obviously is a made up company with extremely optimistic outcomes. What we are interested in seeing what happens if some of these assumptions change.
Now that we have a sample valuation based on some assumptions, we can change the assumptions and see how the valuation changes. Here I vary the starting interest rate in increments of 0.5%, with everything else being the same and see how the valuation changes.

Clearly the DCF valuation for the company changes quite drastically with each increment of 0.5% in RFR. Remember that RFR is essentially a proxy for Treasures/Central Bank rates. So if the Fed or the BoE increases rates, then RFR changes. 20% drop in valuation happens roughly at 1.5% increase from the base case. No wonder that's where the stock market has rerated to so far on news of changing interest rates. Remember that markets are more often than not forward looking in their projections of economics, and hence if the interest rate has only moved by 1%, but the market expects it to increase by another 0.5%, that change will almost instantaneously be priced in. Markets sometimes also over-react to the changes more than is necessary, so the changes in market valuations and theoretical valuation changes will differ from time to time but will converge in the long run.
We are however also interested in knowing what happens when interest rate starts at 1% but gradually increases (year by year) upwards. Here are the projections for that. Obviously the valuations change much more drastically as the interest rate changes are increasing the discounting of cashflows from father away in future.
Most companies won't be able to retain their profit margins when interest rates change, as they might have increased cost of capital for their operations. We can simulate this by altering the rate at which profit margins changes. As we decrease the profit margins, valuations drop, again quite substantially.
Why have growth companies decreased in valuations by so much more (80-90%) than the scenarios presented here?
The reason for much deeper drop in the valuations of growth companies is because the base DCF case for these companies is quite different. Many tech/growth companies weren't generating any profits at all at the moment - in fact they are/were burning cash in order to chase growth. However, the promise of these companies is that growth and improving profit margins will lead to much better cashflow in the future than companies that aren't growing so rapidly. So, I illustrate it with the following sample company's DCF calculation. Notice that the DCF has been extended to 11 years to capture the longer growth period, and the profit margins and profit margin improvements have been adjusted to reflect the base case for such companies.

As you can see, valuing a company like this by traditional measures such as P/E is extremely hard, so discussions tend to use proxies like P/S. This sample company has a P/S of 108.
However, now we have a bit of a twist. Since the company isn't making a profit, the company has to fund the losses that it is accumulating each year. While some companies will look to raise equity funding for this, others will use debt funding. To keep things simple and to focus on the changes brought about by interest rate, let's assume that the funding for losses would come from debt funding. Let's assign an interest rate of 5% as a starting point. While RFR is 0.5% in the base case, no investor in their right mind would give a loss making company loans at those rates. They have to be compensated for the risk of the company going bankrupt. So, I use 5% as a reasonable reflect the difference, or 4.5% over the RFR.
The gap between two valuations is only a few percentage points - this is because while the interim periods of cashflows change and are worse, it is all eclipsed by terminal value when the company starts generating profits.
However, we have now quite a few moving parts, all of which depend on interest rates. Firstly as interest rates move up, your ability to raise capital at the same rate as you did previously is gone. Any cashflows now generated have to be discounted at a higher rate. So as interest rate changes, the drop in valuation is quite substantial.
However, as the company is expected to deliver on an extremely optimistic outlook over the next many years, any small deviation from these super optimistic outlook can be extremely damning for these companies. Here, I simulate what would happen if we lower the sales growth by a meagre 2% (from 30% to 28%) or couple it with a smaller margin improvement (from 17.5% to 16%). Between increasing cost of capital, and increase in discounting rates, and slightly slower growth and slightly slow margin improvement, a company's valuation can drop by as much as 94%!!
Remember that any company that grows by 28% and improves its margin 16% year on year would be an absolute gem to hold in the long run. However, if investors pay too much for these companies, i.e. using super rosy predictions, then the impact of even mild variations in the company's actual performance and changes in macro-economic factors, can lead to outsized changes in valuation. This is what we are seeing played out in the markets presently.
What can we do about all this?
- Focus on valuations - buy companies whose projection don't need ideal conditions. On that, apply a margin of safety for changing circumstances.
- If you feel compelled to buy companies at exorbitant valuations, buy small lots and see how the story pans out. You can always add to your positions.
- If you already hold stocks that have dropped significantly (80 or 90%), but where you expect the story to be intact more or less, consider continued purchase of these shares at lower prices so that you can lower your average cost of ownership over many years. If the company in fact turns out to be a super compounder over many years, your investment will still pay off very good returns. If you started with small lot purchases of these companies and have powder dry, now is the time to add to your position, but only to those companies whose growth story is intact.
Appendix
I use a small function to generate DCF calculations for scenarios. You can find it in the data file, but I am pasting it here for reference:
function calculate_dcf_value(
revenue,
revenue_growth,
initial_profit_margin,
profit_margin_increment,
tax_rate,
risk_free_return,
risk_free_return_increments,
equity_risk_premium,
year_of_terminal_value,
cost_of_capital = 0,
price_in_cost_of_capital = false) {
var dcf = 0;
cumulative_profit = 0;
for(year = 1; year <= year_of_terminal_value; year++) {
y_revenue = revenue*Math.pow(1+revenue_growth, year-1);
y_profit_margin = initial_profit_margin + (year - 1)*profit_margin_increment;
y_pbt = y_revenue * y_profit_margin;
cumulative_profit += y_pbt;
y_interest = 0;
if(cumulative_profit < 0 && cost_of_capital > 0 && price_in_cost_of_capital) {
y_interest = cumulative_profit * (cost_of_capital + risk_free_return);
cumulative_profit += y_interest;
}
y_fcf = (y_pbt + y_interest) * (1- tax_rate);
y_rfr = risk_free_return + (year-1)*risk_free_return_increments;
if( year < year_of_terminal_value) {
y_dcf = y_fcf*Math.pow(1-y_rfr, year - 1);
dcf += y_dcf;
} else {
tv = y_fcf/(y_rfr + equity_risk_premium);
dtv = tv*Math.pow(1-y_rfr, year - 1);
dcf += dtv;
}
}
return dcf;
}


Comments