Affordability of homes in UK 1990 vs 2020
Yesterday, someone brought this image from this twitter thread to my attention
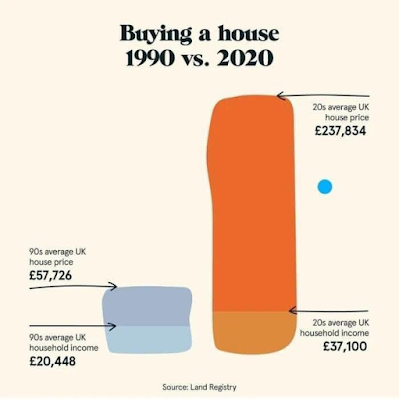
Now, obviously, the image evokes a strong emotional response, something on the lines of
- "OMG! Buying a home has become so costly!"
- "This is the reason I will never be able to buy a home"
- "Our previous generations had it so much better than us"
- "Government should do something about it"
I argue that this graph is only part of the story. Affordability of a home is a combination of prices and interest rates. While prices (as a ratio of average incomes) have gone up between 1990 and 2020, interest rates have vastly come down in the intervening period. Hence the net affordability hasn't changed by much.
First let's establish the difference in interest rates. It looks like mortgage interest in 1990 ranged between 13.75% and 15.40%.
 |
| (Source: link) |
In 2020, the interest rates varied between 1.59% and 2.39% as per this post on statista. HSBC on the other hand, indicates their interest rates to be between 3.41% and 3.64% at the moment. Again let's compute the average of the extremes (1.59%, 3.64%) and take it to be 2.615%.
Now, that we have established interest rate comparisons, let's understand the initial outlay (deposit) and monthly outflow of home purchases across the two comparison points.
Assumptions
Firstly, to compare apples to apples, we need to make a few assumptions:
- I assume that a home buyer would take out 90% loan on the value of the property (LTV)
- I assume that the loans are 30 years in duration
(Both the above assumptions may not hold true in 1990 as LTVs might have been lower and the average loan durations might be shorter. However, for purposes of comparison, I am using these assumptions.)
Raw Comparison
Here is the comparison between 1990 and 2020. The key point to note is the Relative Affordability section.
In 1990, you had to put down about 3.4 months of your income as down payment, and then paid about 38% of your monthly income in mortgage. Over the course of 30 years, the house costed you about 138 months of your salary (that you had when you bought the house). This means you paid 11.5 years of initial salary to acquire the house.
In comparison, in 2020, while you paid 7.7 months of your income as down payment, you only paid about 28% of your monthly income in mortgage. Over the course of 30 years, you paid just about 9 years of initial salary.
While you had to set aside a bigger amount as deposits, overall affordability is actually better than what it is in 1990. Now, putting together 7.7 months of your salary as a down payment is no mean task and I empathise with the struggle that first time buyers have to go through in accumulating this amount. However, overall affordability has improved. This means that first time buyers should concentrate on getting over that initial effort of putting together the deposit. Beyond that, the financial process of home ownership should get easier from there on.
Risks
The obvious risk for where we are right now is - what happens if interest rates rise? That would obviously impact affordability of homes. However, it is good to go back to data. What does each 0.5% increase in interest rates mean to affordability of houses?
As expected, relative affordability keeps getting worse as interest rates go up, but it would still take about 2% - 2.5% interest rate increase to get to a point where the mortgages, as part of your monthly income, as well as the total payment over 30 years, get to the same levels as that in 1990.
Now, we are assuming that there is no relation between interest rates and wages. That is however never the case in practice. If interest rates are rising because inflation is being curbed, then it means employment and wage growth is generally strong. However, rising interest rates mean lower corporate investment, which would mean lower wage growth. Which one would come first and how it will affect individuals is entirely unpredictable at this time.
Summary
Buying a home is a very personal decision, and it adds a significant amount of value to your family life, that cannot be entirely measured by spreadsheets. However, if you have thoughts about "how costly property in UK has become", go through this post to see if you can reset your thoughts.
Original spreadsheet here, for those who would like to inspect the data and formula, or for those who would like to make a copy and play with it.
Note: I have posted a follow up to this post here.
Disclaimer: Anything mentioned in this post should not be considered financial advice. The post should be consumed purely for entertainment and educational purposes.

Comments
What is the solution?!
Would be interested in similar articles from your research if available!
The one dark horse in this equation is creation of new household units - i.e new migrants coming in to a housing market, or people starting families. Net demand (i.e. increase in demand minus the new home creation) will definitely place some pressure on pricing, but I am hoping that's a short term issue and not a structural one.