Portfolio Update - May 2022
I have been building a spreadsheet by which I can quickly look at what all constitutes my portfolio. I do this for my own ability to understand how big a particular position is, and whether or not I should be adding in a particular sector, or country, or category of investments.
Since this tracking has gotten reasonably mature over the past few months, I thought I will share them here.
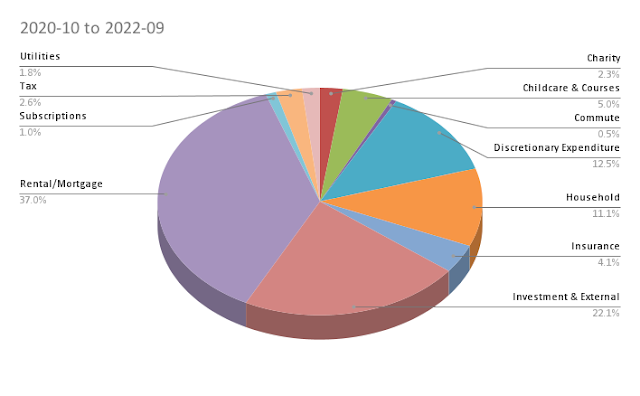
This is the first breakdown. This is based on the sectors of investment I have in my portfolio. Some of the Funds, ETFs and Funds of Funds are so broad in their coverage that I had no option but to categorise them individually.
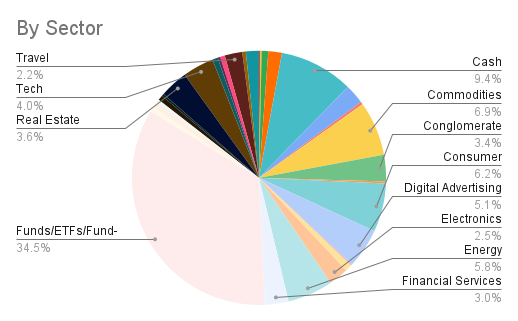
- Allocation to Commodities have gone up (from 4.4%). The opportunities in commodities continues to be interesting.
- Allocation to Energy has come down (from 8.6%). I had one large UK based Energy position and after the windfall tax announcement I have exited that position altogether. I have taken minor energy ETF based derivatives position that I will talk later about
- Cash has reduced (from 10.1%)
- I have exited Aviation altogether - it was only one position and I have exited it altogether. I still have travel exposure. A month before, that sector was 3.9.
Notable changes in the past month:
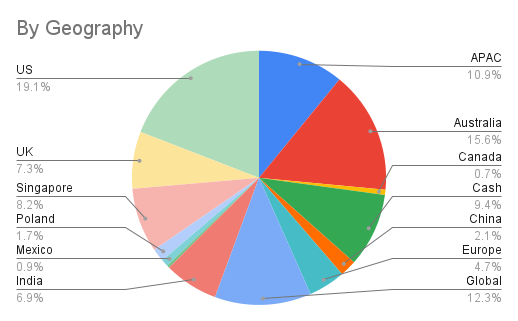
- Australia have gone up (from 9.5%) as it is rich in special situations as well as commodity opportunities.
- UK has reduced (from about 10%) as I have exited the position I talked about in my previous post.
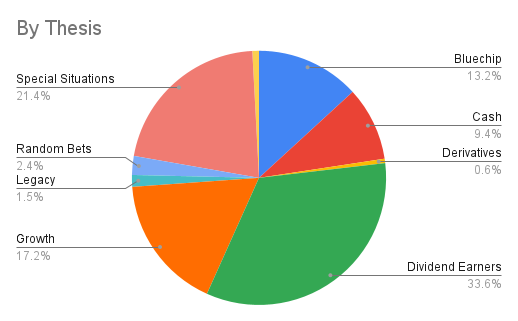
The only notable change here has been a reduction in Derivatives holdings. This is because I have swapped being long on some in the money Calls to being short on out of the money Puts in the same positions. I am tracking here based on price of the PUTs, but the amount of capital at risk (based on the full ex-liquidity of the Puts) is very much similar to previous month. I am also trying out a new chart starting this month, and that is by the expected duration of holding.
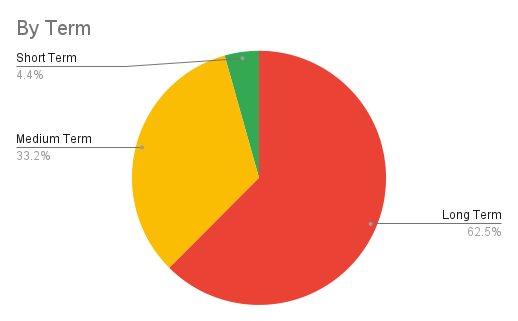
I expect Short Term positions to wind down within 6-9 months, Medium Term to unwind in about 12-18 months and anything longer than that to play out, or positions I plan to hold for a very long period are categorised under Long Term. Since I have only started tracking it, I can’t note any changes. I will track changes in due course of time.
General Notes
Special Situations continue to be very attractive and there are so many trades available in this category. The most public of them are ATVI, TWTR and SAVE and there is ample literature around for you to understand what is happening in these trades. I am involved in all of them, though I am using derivatives with conservative strike prices to enter these positions. I have generally preferred to not write Puts for a while, but given the nature of these opportunities, I have been drawn back to using them for particular trades. Let’s see how they pan out.Special Situations have also been the most resilient to the market volatility in the past 2 months. Since most of the positions are underwritten by some well known price point, or are less liquid and none of the players in the trade have blinked, they have all kept up their price points rather well. Of course, none of that stability will matter unless they also pay off. So, fingers crossed on that.

Comments