What to do when markets are rough? Review what happened between 2000-2013
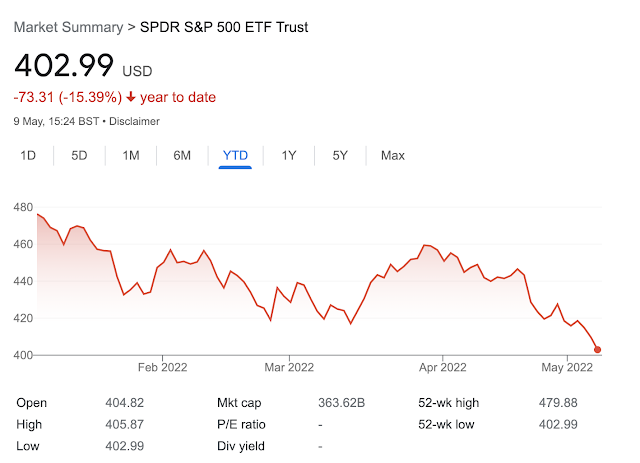
If you are an investor, it is very likely you are not liking what you are seeing in the markets for the first few months of the year.
In UK market, things are better, but still down from the beginning of the year.
There are ample articles explaining what's happening in the markets at the moment, so I am not going to attempt repeating any of the rationale here. However, the more pertinent question - what should one do given what's happening in the markets?
In Psychology of Money, Morgan Housel states (chapter 15):
You can pay this price accepting volatility and upheaval. Or you can find an asset with less uncertainty and a lower payoff, the equivalent of a used car.
In essence, volatility is the price you pay for higher long term returns. That's all good in theory and perhaps the daily/weekly/monthly volatility is easy to ignore and move past. In essence we are saying that it is okay for a stock/ETF/asset to be priced below what I acquired it for, so long as it is somewhat temporary and that the price becomes positive after some time. That "some time" is obviously variable on a bunch of different parameters, but for most people they expect it to be medium-term - i.e. 3-5 years. In fact if you listen to Motley Fool podcasts, they often talk about investing in the market with at least a 3-5 year horizon, so that time period seems to be reasonable to look at.
What if, however, there is an extended bear market where the price of the equity assets you own stay low for a very long period? i.e. what if the period taken for the prices to come back to where you acquired them becomes too long?
Between June 2000 and June 2013, S&P went through an extended phase of not trading in the positive territory. (It went briefly beyond the starting price just before the GFC and promptly returned to negative territory all the way to 2013)
Taken by itself, this looks bad. If you were an investor and had to continue to be investing in an asset that stays under water for no less than 13 years, staying on course would have been exceptionally difficult.
However, most of us don't invest a lump sum of money. We tend to invest a little bit, typically each month, into our portfolios. So, what happens if we take that into account and see how our investment would have done?
Things look a lot better. For the first 3 years or so, you would have been underwater, and then largely in positive territory all the way up to the GFC period, where after a brief tryst with negative territory, you would have been back in positive territory all the way to the end of bear phase. In fact, including dividend reinvestments, you would have made an IRR of 6.47% for the entire 13 years period. That is significantly lower than the S&P historical average of about 10%, but it is not bad for one of the worst long bear phases of the index.
Why does this happen? This is because every time you invest a bit more money when the stock/ETF trades lower, your average price of the ETF comes down. Essentially, you are dollar cost averaging your investments. This is also because dividends come along and if you reinvest them, you are improving your position without putting in any fresh money.
If you were in accumulation mode, this is probably okay. What if you were a retiree with a big portion of your retirement assets in S&P index funds?
This is where it gets a bit tricky. If you are in pure drawdown mode of say 3.6% a year (lending itself to a 3000 per month withdrawal on a 1Million initial holding, which is 100% allocated to SPY), after those 13 years, you will be left with just a 532K corpus and a 1.19% IRR. This is quite bad, for obvious reasons, as you have been drawing significantly more than the IRR leaving you with a smaller corpus. This would likely mean you have a shorter time before you run out of money altogether.
In practice it worked out fine as we saw a big rally in S&P 500 since then leaving such retirees well in sustainable mode as of now.
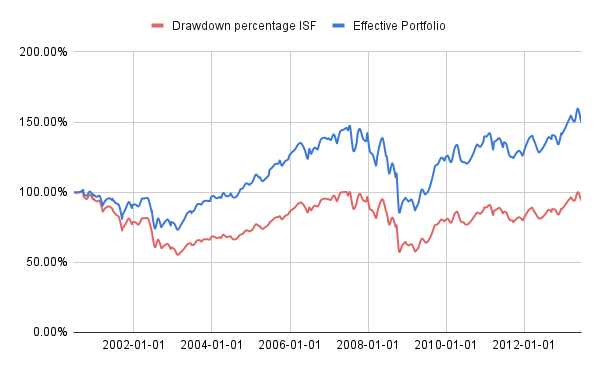
But isn't all of this data US specific? What happened in the similar period in other countries, say the UK?
Turns out, not a very different graph for accumulation phase, when using LON:ISF, a FTSE100 tracking ETF. ISF in the UK returned a marginally poorer 6.4% IRR over the same time period, which, for all practical reasons, is a repeat of the thesis across the pond.
Takeaways
- If your investment strategy is buy and hold, there is little reason to do anything different during a bear market. Your returns won't be spectacular, but given you know nothing about how the future is going to turn out, continuing your strategy is perhaps best. Time in the market is more important than timing the market.
- If you are planning for retirement, consider the strategy of starting your retirement by only using dividends - it is likely going to provide you a significant headroom when asset values drop.
I am sharing the raw data here - you can copy the sheet and play around with other calculations you might want to do.
Disclaimer: Anything mentioned in this post should not be considered financial advice. The post should be consumed purely for entertainment and educational purposes.


Comments